Tablets Rapidly Democratizing and Consumerizing Mobile BI

image Unless you’ve been a castaway on a remote south Pacific island, you probably have a sense that things are changing rapidly in mobile business intelligence. There’s no shortage of companies expressing a desire to grab attention by claiming that their latest incarnation of mobile BI has fundamentally changed. Often, these proclamations herald in a “new BI era” designed to be personal, more democratized, and intended to focus on individual worker needs and not the interests of IT or the enterprise.

I think most of them are lying.

But there is a shred of truth in their press releases and market positioning. They have all recognized that the second wave of IT consumerization – the consumerization of business apps – is indeed a force that must be harnessed. BI vendors and enterprise executives steeped in the mobile climate that is shaking like an 8.0 earthquake under foot, are well aware that to ignore the consumerization of business intelligence, is perilous.

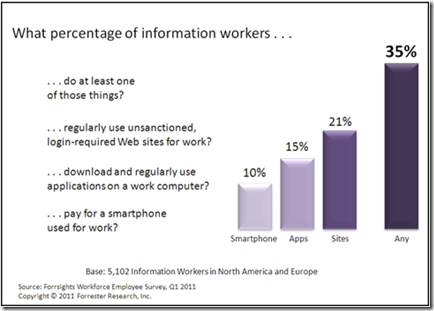
Forrester, in a Q1 2011 survey of 5,102 information workers in North America and Europe, has directly linked consumerization with business outcomes that IT and every other part of a business cares about: innovation, advocacy, and leadership.

image

The percentage of information workers in North America and Europe who do something with technology outside of IT control was pegged at about 35% in Q1 of 2011. Employees bring their personally provisioned smartphone or tablet to work, they use unsanctioned Web sites for business tasks, or they download unapproved applications to a work computer. Why? Because they care about the quality of their work and the satisfaction of their customers. The study suggests that by-and-large, they do this in the best interests of their company.

Mobile BI is not immune to the consumerization movement, and if anything, it is on the leading edge of change because tablets have proven to be the most ideal, most useful innovation to occur in business intelligence since the invention of pivot tables. Tablet apps for BI fundamentally transform analytics and data visualizations. But it doesn’t end with the BI basics. Always-on connectedness through social networks, collaborative systems, email, and peripheral news feeds, combine to elevate the science of awareness and knowledge about business operations unprecedented in the checkered history of business intelligence. Almost in the blink of an eye, mobile BI has reinvented itself and not a single BI vendor can be credited with making this happen.

Despite lack of early involvement in the consumerization movement, BI vendors are not sitting idle as workers reshape the intelligence landscape. Yellowfin recently announced the availability of its new iPad app which takes a more consumerized approach to a business intelligence user interface. It uses a Flipboard-like interface which makes it a little easier to locate and drill into business data.

Eduardo Ferrin, creator of Balanced Scorecard for iPad, indicates that businesses of all sizes are adopting his simple but effective strategic planning tool because it is a reflection of what people want, not what enterprises want for their people. According to Mr. Ferrin,

“Users are not happy with current mobile BI offerings because (for the most part) they are just an extension in mobility of their desktop applications which fail on many levels to address key requirements for individual’s work styles and their objectives concerning business data. These current offerings were designed just as another spoke, not as the hub of an entirely new user-focused experience.”

BI is a Dialogue, Not a Monologue

The introduction of social networks, collaboration, and gamification into the folds of business intelligence activities, is as much a disrupter of the BI market as tablets and apps that free workers from physical and information access constraints. Today, the challenge for BI vendors is to find ways to blend information at the edge of the enterprise with operational and performance data to create a new kind of BI experience – one that is designed for more for workers and less for IT.

Encapsulating and institutionalizing scorecard and other business intelligence methodologies in a lightweight and simplified software form factor, magnifies the opportunities to accelerate the capacity for business intelligence deeper into the enterprise. This is the essence of leveraging consumerization to effectuate the democratiation of business intelligence.

The vehicle for achieving this does not yet exist.

Posted in Articles about Business Intelligence, Productivity | Tagged , , | Leave a comment

iPad Creates Unexpected BI Demand, Workers Involved with BI Yield Tangible Results

The consumerization of IT has started to create some interesting opportunities that will open the doors to more pervasive use of business intelligence in enterprises. Our paper on the subject (Strategic Planning for the Entire Organization) points out accurately that:

“The alchemy of business intelligence, agile strategic planning, and mobile computing have combined to produce a seriously compelling value proposition for businesses and most important – everyone in the organization.”

Ann All recently published similar feelings about the democratization of BI in a timely piece entitled “Creating a Business Intelligence Culture”. In it she wastes no time indicting the IT community:

“Companies are limiting the potential usefulness of BI by making it available only to specialists, who create reports from centralized data and make those reports available only to select decision makers.”

imageThis, as Ann would likely agree, is flawed thinking.

Several companies featured in a recent Computerworld article are seeing tangible results from getting more users involved with BI. The story indicates that at 1-800-Flowers.com, users with access to real-time sales data created a quicker checkout process for fast-selling items, and likely reduced costs and increased customer satisfaction. Bobby Nix, director of BI and analytics at consumer services company Allconnect, noted a 26 percent sales increase in 2011’s first quarter to staff access to business intelligence data. The cause — it helped sales associates focus on the best sales opportunities. And the Cincinnati Zoo & Botanical Garden realized a 30.7 percent per-capita increase in food and beverage sales from October 2010 through the first quarter of 2011 that the director of park operations attributes to availability of BI data deeper in the organization.

A reluctance by IT groups in general to embrace the democratization of BI, underscores a general attitude in the IT community concerning the definition of BI. IT groups have a traditional view that BI must include a hefty dose of analytical processing, a task reserved only for “analysts” capable of making sense out of data. However, there are really two hemispheres of BI – one concerned with big data, analytics, and strategic objectives. The other BI hemisphere – the one used by companies in the Computerworld article — is kinder, gentler, and focused on performance indicators, micro-strategies, and delivering information that improves operational decision-making. This is a more tactical tilt to BI and in some regards, it suggests that there’s an ongoing evolution of how IT and employees view the separation of strategic and tactical information.

iPhone Kicked the Door Open, iPad Kicked Down the Entire Wall

iPhone started a micro-revolution in businesses by enabling access to data more easily and in visual contexts that were more useful than any mobile devices before it. It set the stage for an information-starved workforce that quickly realized a consumer product could provide fundamental information access benefits.

On the heels of iPhone use in the enterprise, iPad has created an unexpected demand for BI in the second hemisphere. Employees needn’t be classified as “mobile workers” to benefit from mobility and pervasive access to business intelligence. And BI vendors have been quick to validate these new mobility requirements.

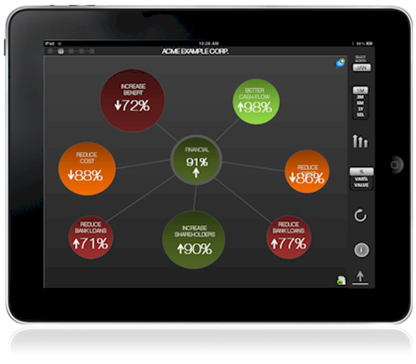
Deep down in the enterprise, there’s a movement that is tactifying the domain of BI which was previously isolated to strategic planning activities. Businesses – mostly mid-level managers responsible for operational performance – are reshaping the fabric of BI and the core definition of this term. Balanced Scorecard for iPad is one such tool that has embraced this movement.

Posted in Articles about Business Intelligence | Tagged , , | Leave a comment

Balanced Scorecard for iPad Selected as Seedcamp Finalist

According to a recent post from Seedcamp,

“We’re excited to announce the teams attending Mini Seedcamp Prague, once again we had some very technical, ambitious, and creative teams applying to participate. This time we received entries from a total of 31 countries! As a result this will be our most international Mini Seedcamp yet with 16 countries being represented on the day. We have more than 70 mentors signed up to spend the day with these twenty teams.”

This is a big step forward for BsC, which has created a new market for the balanced scorecard methodology on iPad.

According to Eduardo Ferrin, founder and creator of this popular app,

“I am very excited to learn we are a Seedcamp finalist. Our team has worked very hard to make an ideal app for strategic planning for more people to use in the enterprise. At Seedcamp we will be showing just how easy it is to create and managed a business dashboard to achieve planning and monitoring control – all without high costs or PCs.”

Seedcamp is slated for 20 October 2011 in Prague.  It is a one day event designed to connect the 20 best web-tech, mobile and software talent with some of the leading entrepreneurs, developers, and experts from all across Europe and all over the world.

Twenty finalists get to connect and learn from prominent entrepreneurs, investors, developers and other web technology experts. The day consists of 5 minute presentations by the teams, a panel discussions, and four 1:1 mentoring sessions. The format is designed to maximise interaction between the teams and mentors, and has proven to be exceedingly popular with mentors at previous Seedcamps.

Posted in Articles about Business Intelligence | 1 Comment

Consumerization of Apps Spreads to Business Intelligence

This paper on the consumerization of apps by Bill French, founder of iPadCTO demonstrated a rapid slide toward apps as a second wave of IT upheaval. If true, companies will need to not only deal with consumerization of mobile hardware and personal provisioning, but user provisioning of apps themselves.

On the heels of this paper which foretells the coming consumerization of apps, today I saw a promotional email from QlikTech (the makers of the iPad BI app QlikView) and the subject line promoting their new white paper says:

“White Paper – BI as easy as consumer apps”

As evidenced by their attached white paper (and subject line), now the bigger BI players are consumerizing themselves. I guess Bill’s white paper is spot on – apps are now officially the second wave of consumerization.

As the QlikTech email promotion accurately states,

Traditional BI solutions delivered the same thing for years: static monitoring reports that addressed only a fixed set of predetermined questions. But suddenly there’s a radical shift shaking things up, and the force behind the transformation has caught many by surprise.  The QlikView white paper, Business Discovery: Powerful, User-Driven BI explains how empowered consumers are demanding the same functionality at work that they get from their personal technology.

Hmmm… “… consumers are demanding the same functionality at work that they get from their personal technology.” Let that sink in for a minute.

Posted in Articles about Business Intelligence | Leave a comment

Balanced Scorecard for iPad: Good for Tracking Performance Across Projects

While most of us think of strategic planning as this big mysterious process that only executives get involved with, the balanced scorecard methodology is patterned such that it can be leveraged in many use cases.

Even the smallest projects, seemingly tactical in nature, have a strategy, and this is where the BsC app shines. In minutes, and while standing on a trade-show floor, I was able to create a few business development objectives and track my progress over a four day conference.

It’s not difficult to imagine using BsC for these projects in addition to your overall corporate planning.

  • Event planning
  • Software engineering
  • Advertising projects
  • Competitive intelligence

One misleading aspect of the BsC app is the nomenclature used for strategic projects. It assumes strategic projects are synonymous with a company name, but it also provides the ability to create strategic plan documents for many companies. However, there are no problems for using the app for one company with multiple strategic plans.

If you use balanced scorecard in wild use cases, we want to hear about them.

Posted in Articles about Business Intelligence, Productivity | Tagged , , | 1 Comment

[Free Giveaway] Peak Meetings for iPad, An Incubator for Strategic Execution

Update: Send me an email (bill.french@ipadcto.com) if you’d like a free promo code for this app. Limited supply.image

There are so many meeting planner apps available for iPad, but only one stands out as a vehicle for creating seamless connectedness between your company’s strategic plans and execution. And this one also blends nicely with Balanced Scorecard for iPad.

Peak Meetings, by Creating Thunder, has hit on an idea that has always seemed to escape the meeting management process. We hold meetings far too often that last far too long. And yet, few of them can actually be mapped to key performance metrics let alone, strategic plans.

It seems as though businesses, large and small suffer from a chronic disconnect between the many elements of a vision and the implementation steps necessary to reach for the visions. I believe that the glue that binds vision with implementation steps and details lay in the meeting planning and management DMZ.

Institutionalizing a process that creates a tightly bonded relationship between meetings and strategic plans is likely to pay big dividends. In my own business activities I’ve begun to use Peak Meetings to establish key touch-points that bind specific implementation steps with my strategic objectives.

Simple Example

As shown in the screen shot above, I’m working on a project that leverages Google Docs and Google Apps scripting to integrate business data with lightweight BI solutions. Google Docs has become the best alternative for companies that need to manage and collaborate on financial and operational data without spending a fortune on seat licenses for Microsoft Office.

On this strength also comes many other benefits including the collaboration and document sharing features of Google Docs. However, utilizing Docs-bound data for automated, and near-realtime dashboards requires a little scripting and a keen understanding of XML interfaces. My strategic vision is to help companies, who lack these resources, to liberate key performance data so that mobile dashboards can be created and maintained with little effort, no intrusion on current processes, and at affordable costs.

This is what the strategic vision looks like in Balanced Scorecard, also an iPad app for strategic planning.

image
This is a snapshot of recent planning meeting concerning this strategic initiative in Peak Meetings. Can you see the pattern? I’ve been using both apps for a long time now and I find it difficult to engage in strategic planning without bost apps.

image
Successful Meetings Redefined

It’s obvious that the designers of Peak Meetings has really stepped outside the traditional scope of the definition of “meeting”. They’ve taken great liberty to innovate on the essential responsibilities of meeting planning and created a much broader concept that redefines what it means to have a successful meeting.

In this app, the envelope has been opened so widely that the mere process of setting up a meeting invites you to justify it in the context of strategic objectives. This app doesn’t make it easy for you to take the latitude of calling a meeting without expressing merit, conditions, and outcomes that everyone must be aware of.

If your company insists that this app is the framework for planning and managing meetings, a natural success pattern starts to emerge and a knowledge base reflecting intimate planning and execution details, begins to form. One must ask – have the app designers considered the inherent relationship between Peak Meetings content and the bigger scope of knowledge management, deep collaboration, and pervasive awareness tools such as RoamBI, Geckoboard, GroupME, and Present.ly?

It’s Not Just About Meetings

One thing I’ve noticed about this tool is it’s ability to function as an inward, thought-provoking planning tool. You don’t have to have a physical or virtual meeting to benefit from the process that Peak Meetings encourages.

In this context, where you may be the only attendee to a meeting, you might compare this app with note-taking tools, to-do lists, or other project management solutions. But unlike the unstructured approach many of these tools deliver, Peak Meetings provides structure to help you capture key data points when trying to flesh out ideas based on current business conditions and the facts necessary to accurately assess a given problem.

Peak Meetings, A Keeper

Peak Meetings is a keeper and it’s just one of those apps that raises the bar for companies that know just how useful iPad is as a business tool. Peak has the potential to change the meeting game in your company, and because of this, I have to give it one big ding – it needs better integration capabilities.

It could become so useful that the expectation of deep collaboration and integration with other systems is mandatory as it gains traction. As I mentioned above, the data embodied in this app is likely to become extremely valuable. If integrated wisely, it could represent a way to a voice corporate amnesia, potentially saving organizations lots of money in repeated mistakes.

We’re familiar with the phrase “Email is Where Knowledge Goes to Die“. Meeting content is typically dead when the team folds up their notebooks and absconds with the remaining cookies and sandwiches. Peak Meetings is in a unique position to change the game before, during, and long after the meeting has ended.

Posted in Articles about Business Intelligence, Integration, Productivity | Leave a comment

Balanced Scorecard for HR Gains Popularity, Strategy Map Seen As Critical Success Factor

image I’ve been following a group conversation about balanced scorecard and HR and while I’m not an expert in these matters, the people driving this conversation seem to be zeroing in on some key elements that are important for HR organizations to consider.

According to Joe Clark, Chief Executive Officer at Prana Business, Arvato’s case study reveals a key success factor of HR is to provide measurable value to the business and shareholders.

As outlined by the Vice President, the HR team created a vision to transform the function of human resources into a leading-edge work team that delivers measurable value to the business and shareholders. The emphasis of the vision was on strategy execution and enabling the business to create sustainable competitive advantage.

The study follows a balanced scorecard approach to align and link the activities of the team to the firm’s objectives. While the case study provides clear guidelines for implementing an HR-centric approach to using balanced scorecard, Joe chimed into the real-time conversation adding,

“HR and many other functional units within an organization often lose site of the fundamental reason for any company to exist. That reason is to answer this question: ‘Why does our customer buy from us versus the competition?’ HR executives should rigorously focus their team’s activities on helping the firm answer that question.”

This seems like a reasonable method of focusing introspection on an organization and its ability to raise the value of the company. I suppose asking why customers but from your competition is also a worthy analytical point of view. But the ultimate test of of this introspection – can you answer the question – lay at the foot of strategic analysis. Joe makes it clear in this advice.

“If you can’t figure out how those items help answer that question then why is your group performing them?”

This is the nexus that leads to proper strategic alignment of functional support in a company such as the HR function. Joe’s company also provides a brief guide on this topic – 6 tips for HR execs to “get a seat at the table.” It’s a quick read and very useful guidance.

Alan Fell, Director at Alan Fell Consultancy Ltd, validates this approach.

“Challenge # 1 is to have a good corporate strategy map and then to develop an HR function strategy map as a subordinate exercise. That usually clarifies the questions of what is the real business purpose of HR. In other words – strategy alignment.”

Alan makes clear that a key problem is the existing role and capabilities of most HR departments – they are really not strategic. So a great outcome of creating an HR Scorecard is to open the debate concerning the strategic role of HR in a company. James Creelman, Senior Strategy and Quality Expert, Ministry of Works, Bahrain, echoes Alan Fell’s sentiments concerning strategy maps.

“… we should not use the term Balanced Scorecard unless it includes a Strategy Map. Remember a Balanced Scorecard is a Strategic Performance Management Framework not a performance measurement (or even management) framework.”

SHRM India provides a useful example of using scorecard to drive direct alignment of corporate goals with one aspect of HR, recruiting.

  • Objective: Reduce turnover costs.
  • Description: Develop effective recruiting methods and new-hire orientation methods to optimize the retention of new hires.
  • Actions:
    • Identify key attributes of successful employees who stay at company for two or more years.
    • Utilize technology more effectively for recruiting and screening applications.
    • Identify selection methods that will contribute to successful hires
    • Integrate branding efforts into recruiting.
    • Revise orientation program to ensure new-hire retention.
  • Measures:
    1. Cost-per-hire (financial).
    2. Turnover rates and costs (financial).
    3. Time-to-fill (business process).
    4. Customer satisfaction with new-hire performance (customer).
    5. New-hire satisfaction with orientation (learning and growth).
    6. Supervisor satisfaction with orientation (learning and growth).

As evidenced by a study conducted by SHRM India, slightly more than a third of executives view HR as a strategic partner, yet everyone gives enthusiastic lip service to the idea that its people are a company’s greatest asset. As I follow HR discussions concerning the application of balanced scorecard, it has become increasingly apparent that organizations which undertake the challenge of identifying clear and compelling connections between the company’s strategic plans and the work of each employee, naturally raise the HR performance and the company’s performance. This single directive seems to provide strategic continuity.

When I first started learning about balanced scorecard and how it can be used in a company, I assumed this approach was designed for the C-suite; the domain of executive management. But as I learn more about the unique relationships established through strategy maps and HR’s role, I can clearly see why democratization of scorecards and utilization down to every worker’s role in a strategic sense, is such a valuable idea and Balanced Scorcard (HR) for iPad is an ideal tool to embrace this emerging trend.

Posted in Articles about Business Intelligence, New in Balanced Scorecard for iPad | Tagged , , , | 1 Comment

BsC Offers New Balanced Scorecard Training Resources and Upgrade to Strategic Planning App

Balanced Scorecard for iPad

Business Strategy Consultoria of Madrid, Spain has recently updated its popular Balanced Scorecard app for iPad. The new release, version 2.1, includes improved data entry, security options when deleting a company profile, and the elimination of a data sync issue. a complete Dashboard that lets you Monitor the Progress of your Business Strategy and Design your own Balanced Scorecard . You can Control the Success of your Strategy each month through the Measurement of most Important Indicators.

The upgrade is free and it’s currently available in the App Store.

Balanced Scorecard for Excel

In other news from BsC, a crop of training and support videos have been published for their improved Balanced Scorecard for Microsoft Excel product which retails for $20 Euros. The training resources are free. Here’s an example.

Enhanced by Zemanta
Posted in Comments by Users | Tagged , , | 1 Comment

Integrate BsC Data With Google Docs Using XML: Part Two

In Part One of this Two Part post, we discussed the transformation of BsC’s XML format into English using an XML transformation I created. This provided two demonstrations – we parsed the entire company file of a BsC example, and we also made it possible to have an English version of the original Spanish XML schema.

Today we’ll build on our expertise with XML to integrate a BsC project into Google Docs so that we can create some interesting financial data.

One of the really cool features of Google Docs spreadsheets is it’s ability to read XML data over HTTP. As you may recall from the Part One exercise, we hosted a BsC strategic plan document on DropBox, and we can repurpose it now to access it and extract specific data values right from inside a Google Docs spreadsheet.

Creating an XML Spreadsheet

For this example, I created a blank Google Docs spreadsheet and formatted columns to accommodate month, target value, real value, and delta. The objective is to get the target and real values for twelve months and compare their differences. This is a simple example, but it demonstrates two basic integration essentials – (i) using BsC XML documents and (ii) parsing them to retrieve the desired information.

Google Docs provides a special function for retrieving data from XML documents. The format of the function is:

=ImportXML(“URL”, “XPath”)

By programming a specific cell with this function and including the URL to the BsC document and the XPath to the information we desire, we can specify specific data elements or ranges of elements. XPath, the standard for Parsing XML files, is necessary because the BsC document contains many data elements, but for this example we only want the twelve months of target and real values associated with idIndicator #23.

To limit the scope of the data we harvest into the spreadsheet, the XPath will look like this:

//database/data/monthIndicator/row[idIndicator=’23’]/targetValue

The URL we will use is the same one we created in the Part One article that transformed the original BsC Spanish version to an English version, which I can understand a little better.

http://blogsite.com/public/item/268847

The complete function that we will use to retrieve the target values for the desired data looks like this:

=ImportXML(“http://blogsite.com/public/item/268847”, “//database/data/monthIndicator/row[idIndicator=’23’]/targetValue”)

By placing this function in the spreadsheet on the first cell under Target Value, the Google Docs scripting engine will retrieve the first XPath matching target value and place it in the same cell. The XMLImport() function is also smart enough to retrieve all XPath matches for idIndicator #23 and drop the values in the subsequent 11 additional rows of the same column. With one function call we have acquired a full year’s data for this target value.

Since we need the Real Value for each of the twelve months for this indicator, we must repeat the process in the adjacent cell of the first row. The function to retrieve the real values for all twelve months is almost identical, except that the XPath must now parse for “realValue” instead of “targetValue”.

=ImportXML(“http://blogsite.com/public/item/268847”, “//database/data/monthIndicator/row[idIndicator=’23’]/realValue”)

Our spreadsheet is complete – we are able to harvest the two columns with our two XMLImport() functions and compare target values with real values. 

image

As the BsC data is updated in the XML company file, as long as it is available at the same URL, the spreadsheet will always show this report using the latest data.

The XMLImport() function can be used to extract BsC data for reporting and many other spreadsheet uses. It can also be integrated into many other applications; this example demonstrates just one possible use case for BsC XML documents. But this also demonstrates how BsC data can be liberated from the confines of an iPad app and its proprietary data format. Once the information is freed, we can extend this example by using it in a dynamic BI dashboard.

Geckoboard

image

I like Geckoboard (a lot). My affinity is the ease with which you can sculpt XML on the fly to create dynamic dashboards. I perfected a scripting model that also allows me to generate Geckoboard XML components from within Google Docs, so this is a great opportunity to extendthe BsC data out to a totally different BI dashboard.

By taking a selection of the data from the dynamically updated spreadsheet, I can transform it into a dashboard widget. In this example, I’ll use the January data to create a widget that shows the target value, the real value, and the delta.

Wrap Up

As you can see – the freedom to repurpose BsC data is there – you just need to liberate the information using XML. While there are many aspects of XML integration and always-available web services that need to be considered including security, the tools and services are relatively straightforward. If you have questions about these exaples or ways you can leverage BsC data, don’t hesitate to contact me.

Posted in Articles about Business Intelligence, Integration | Tagged , , , | Leave a comment

Integrating Balanced Scorecard for iPad Using XML

This is a pretty technical topic, but I think a number of users of this Balanced Scorecard for iPad (BsC) will find this information interesting at some level. If you ever want to integrate your scorecard data with othersystems, this article will certainly come in handy.

This is part one of a two-part article. The first part deals with a localization issue and the second part will show you some practical use cases for leveraging BsC data files.

BsC Supports XML

In case you missed it, the most recent update to Balanced Scorecard for iPad (BsC) provides a feature that allows you to not only share scorecard files through a web service, but also export and share them in XML format. The new XML abilities make it possible to import your BsC projects into other enterprise systems. Given this ability, BsC data can now flow into almost any environment including reporting tools, collaboration systems, and even accounting systems. It is also possible to perform round-trip updates since the XML format may also be imported back into BsC.

As I began to experiment with BsC’s XML format I slammed into a wall right away. The XML schema is defined in Spanish and I barely read and write English. As soon as the dust settled I realized – okay, no worries – there’s a companion technology to XML called XSLT (Extensible Stylesheet Transformation Language). If indeed BsC’s XML format is valid and well-formed, I should be able to translate the documents in a jiff. So, without breaking my integration stride, I created a simple transformation document with the help of some translation guideposts from Eduardo (at BsC) and Google Translator.

Why is an English Version of the BsC XML Format Important?

Integrators are far more productive (and precise) if they can look at an XML document and understand what each element represents. This is one of the great advantages of XML and why so many companies, even brutal competitors, have agreed that this is an ideal interchange format. The following snippet from a BsC XML document is really difficult for me to read.

image

However, the next snippet, transformed into English, is quite easy to understand.

image

What Does XSLT Do?

It’s very simple really – it allows you to parse an XML document and change it (transform it) into something else. The “something else” in this case is the same data but with a different XML schema; specifically a schema that I, and everyone who reads English, can readily understand.

Writing a transformation stylesheet requires the use of XSL (extensible stylesheet language) and it so happens I have some experience doing this. With a few hours of tests and another few hours of translation effort, I was able to create a simple Spanish-to-English transformation script. This involves reading the BsC format and writing out the same data but with a different set of XML elements (in English).

XSL uses rules to match and then generate something different. In this case, we want to generate another XML document, but XSL can also generate anything you want it to – CSV, HTML, DOCX – pretty much any format you can imaging, XSL can generate. I think it can even generate binary files, but I’m not sure about that.

My transformation engine matches XML elements in the BsC document such as the month data block. As you probably know, BsC’s strategic planning model requires monthly data, and the Spanish element used in the schema is “MESINDICADOR”. I want that to say “monthIndicator” so I create a transformation rule to look for this block of elements and replace it with my own [English] schema.

image

You Can Experiment Too

I  published my Spanish-to-English transformation engine at this address:

http://blogsite.com/public/item/268847

If you run this URL, avoid doing so in IE browsers – something about it isn’t well behaved. Calling this URL without any parameters will automatically select and transform a sample BSC file that I hosted here. It is the raw, native Spanish version of a BsC file.

If you want to pass your own BsC file to this transformation tool, you have to place it on a web server of some type and then add the parameter as shown in this example.

http://blogsite.com/public/item/268847?xmlFile=http%3A%2F%2Fblogsite.com%2Fdocs%2Ftest.xml

Note that the URL for the BsC XML file is URL encoded. This is important and if you don’t know how to encode URLs so that they can be passed as URL parameters, this free online tool will help you. You can also use DropBox as a temporary web server. Just use the public folder feature in DropBox to store BsC files that you want to pass to this transformation engine. DropBox also provides a feature in its web interface to copy the public URL to any file you’ve uploaded.

So that’s it for today – you now have the tools to see what BsC generates in terms of XML content from an English perspective. Part two of this series will provide a number of examples for leveraging BsC XML in real situations.

Stay tuned…

Enhanced by Zemanta
Posted in Articles about Business Intelligence, Integration, New in Balanced Scorecard for iPad | Tagged , , , , , | 1 Comment